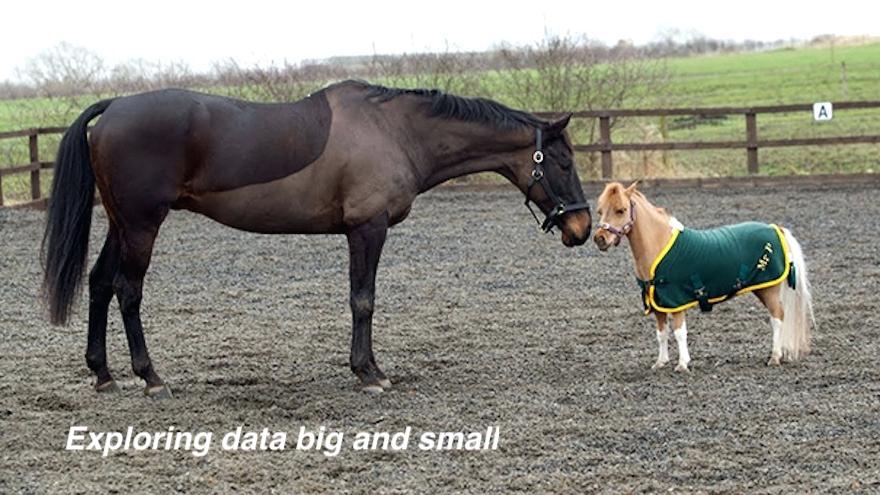
Exploratory Data Analysis

Data Science Institute
Vanderbilt University
Course Overview
Course Materials
Course Policies
Exploratory Data Analysis
This course is designed to serve students of the Vanderbilt Data Science Program.
Note: previously, these materials were hosted under the dsi-explore/eda-class-materials repo. (We also had separate repos for different weeks of data applications). Now we have combined all materials into this location. Instructor’s versions are hosted privately by Dr. Cassy Dorff. Please email me at cassy.dorff@vanderbilt.edu for more information.
Overview
Course summary: This course will teach students how to explore, summarize, and graph data (big and small). Learning topics are broken into three parts over 16 weeks, they include: principles of perception, how to display data, scatterplots, histograms, boxplots, bar charts, proper data summaries, dimensionality reduction, and unsupervised clustering algorithms, such as principal component analysis and k-means clustering. The course will utilize a variety of data types including text data, network data, survey data and many others.
Learning Goals
Course goal: Students will learn how to organize, visualize, analyze, and interpret data in the R programming language.
Learning objectives:
- Gain proficiency in data wrangling, visualization, and analysis in R
- Gain proficieny in the basic use of gitHub
- Learn how to keep files both locally and remotely organized
- Increase data literacy and data communication
- Learn when do use the appropriate graphic and analyses to summarize data and report trends
Schedule
| Component # | Part | Topic | Class Week |
|---|---|---|---|
| - | 1 | EDA in Data Science | 1 |
| 1 | 1 | Summarizing Data | 2 |
| 2 | 1 | Foundations of Graphics | 2 |
| 3 | 1 | ggplot2 fundamentals | 3 |
| 4 | 1 | Visualize: distributions | 3 |
| 5 | 1 | Visualize: correlations | 4 |
| 6 | 1 | Visualize: rankings & other patterns | 5 |
| 7 | 1 | Visualize: time series | 6 |
| 8 | 1 | Presentations (hw) & midterm review | 6 |
| - | 1 | Midterm Exam | 7 |
| - | 2 | Wrapping up Time series, Exams Review, Final Projects | 8 |
| 9 | 2 | Introduction to Machine Learning | 8 |
| 10 | 2 | ML: Unsupervised Learning, k-means | 9 |
| - | 2 | Project work day (short week due to holiday) | 10 |
| 11 | 2 | ML: Unsupervised learning, k-means II | 11 |
| 12 | 2 | Introduction to spatial data / maps | 12 |
| 13 | 3 | Introduction to text-as-data | 13 |
| 14 | 3 | ML: Dimension reduction, principal component analysis | 14 |
| - | 3 | Week 15 is a Holiday break | 15 |
| - | 3 | TBD: Data quickfire + Final project work sessions | 16 |
Location & time
Class: Tuesdays & Thursdays 2:35-3:50 PM Engineering and Science Building, room 048
Office hours: Tuesdays & Thursdays 4:00-5:00 PM Engineering and Science Building, room 202
Instructor
Cassy Dorff, PhD
Assistant Professor
Department of Political Science
Commons Center PMB 0505
230 Appleton Place
Nashville, Tennessee 37203-5721
Teaching assistants
Colin M. Henry
PhD Student
Department of Political Science
Office Hours: Following class for 1 hour!
Contact: slack @ Colin Henry
Yue Gao
Master Student
Department of Biostatistics
Office Hours: Following class for 1 hour!
Contact: slack @ Yue Gao
Textbook & References
R for Data Science by Garrett Grolemund and Hadley Wickham
There are many additional references for this class that you can find listed at the end of each week’s .rmd file!
Computing
This course is taught primarily R using Rstudio. Other elements: github, SQL, accre cluster